01
Research
Reviewing Twinfinity’s existing interviews, survey responses and internal material, then conducting a complementary interview to better understand sustainability consultants’ tasks and needs.

LIA Project · 2025
How can complex sustainability data become easier to understand and act on within BIM workflows?
My Role
UX/UI Designer
Team
2 UX Design Students
Company
Twinfinity
Institution
University of Skövde
01 · Overview
During my studies at the University of Skövde, I worked as a UX/UI Designer in collaboration with Twinfinity. Together with a peer, I developed a concept for a BIM-based application supporting climate calculations and reuse inventory within the construction industry. The concept explores how carbon footprint data can be integrated directly into BIM workflows, giving sustainability consultants a clearer and more user-friendly way to work with climate data and make informed decisions.
02 · The Challenge
Sustainability consultants in the construction industry often work across fragmented tools and manually handled data when calculating carbon emissions and managing reuse information. This makes it harder to maintain an overview and turn complex building data into actionable insights. The challenge was to explore how BIM data, carbon calculations and reuse information could be brought into a more connected and manageable workflow.
03 · Process
01
Reviewing Twinfinity’s existing interviews, survey responses and internal material, then conducting a complementary interview to better understand sustainability consultants’ tasks and needs.
02
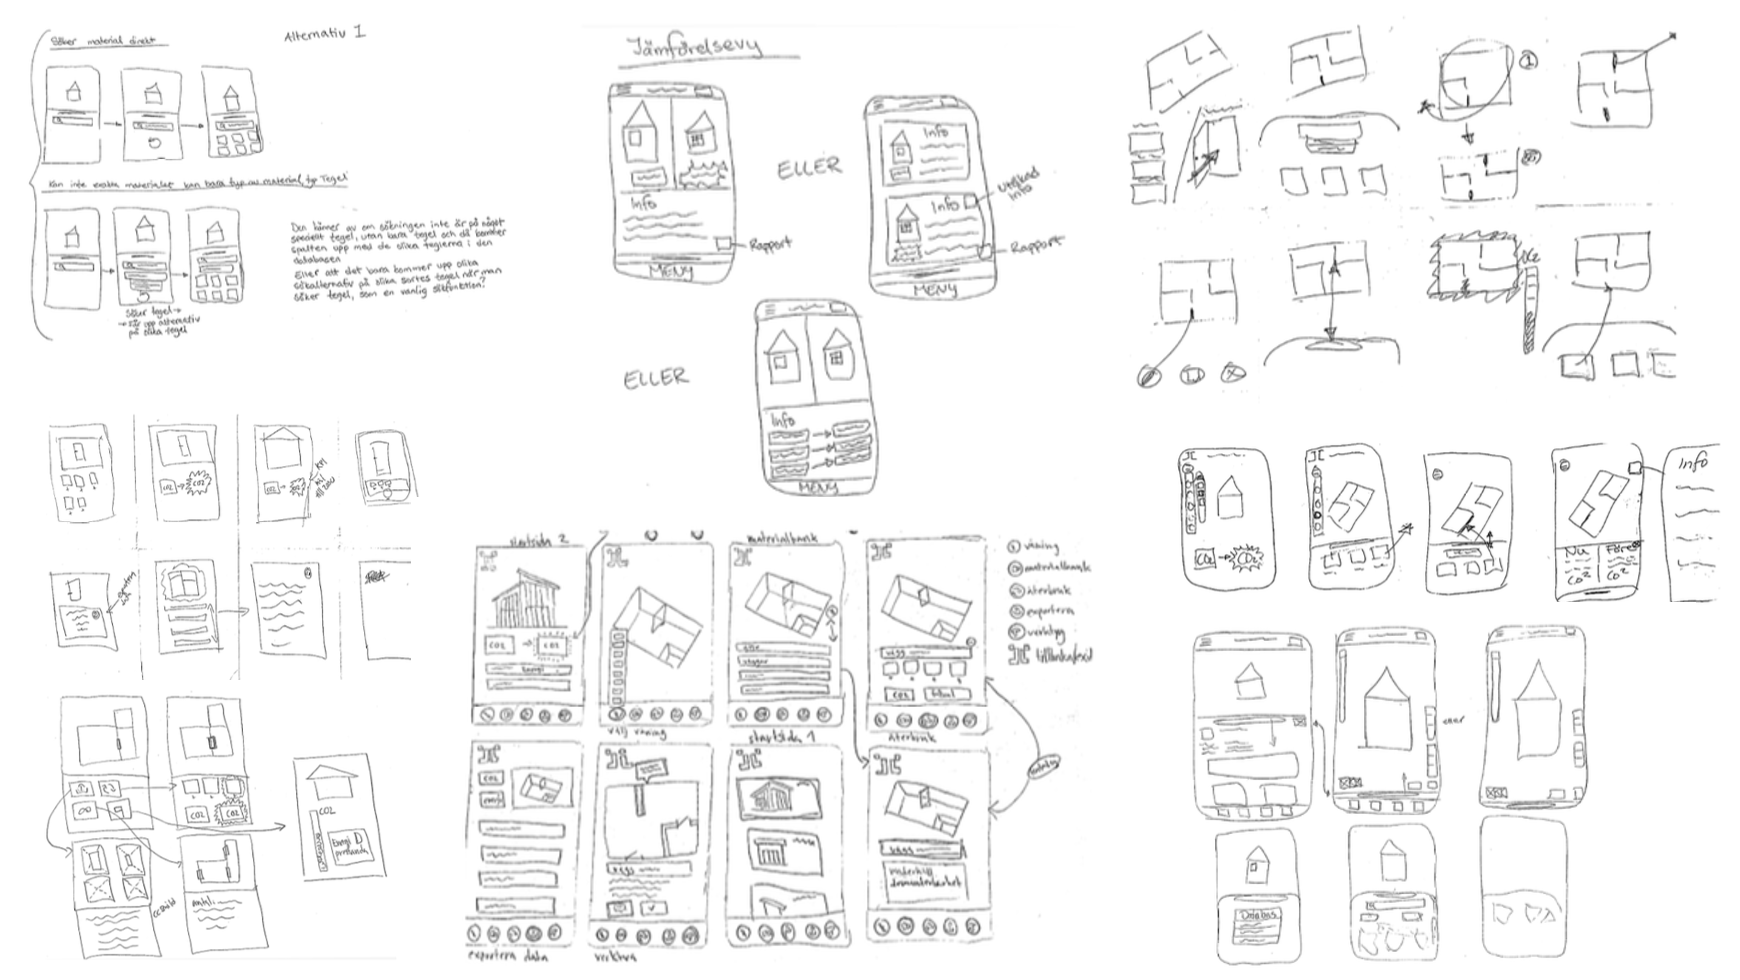
Mapping requirements and exploring concepts through mind maps, sketches and a Crazy 8s workshop with Twinfinity’s UX designers.
03
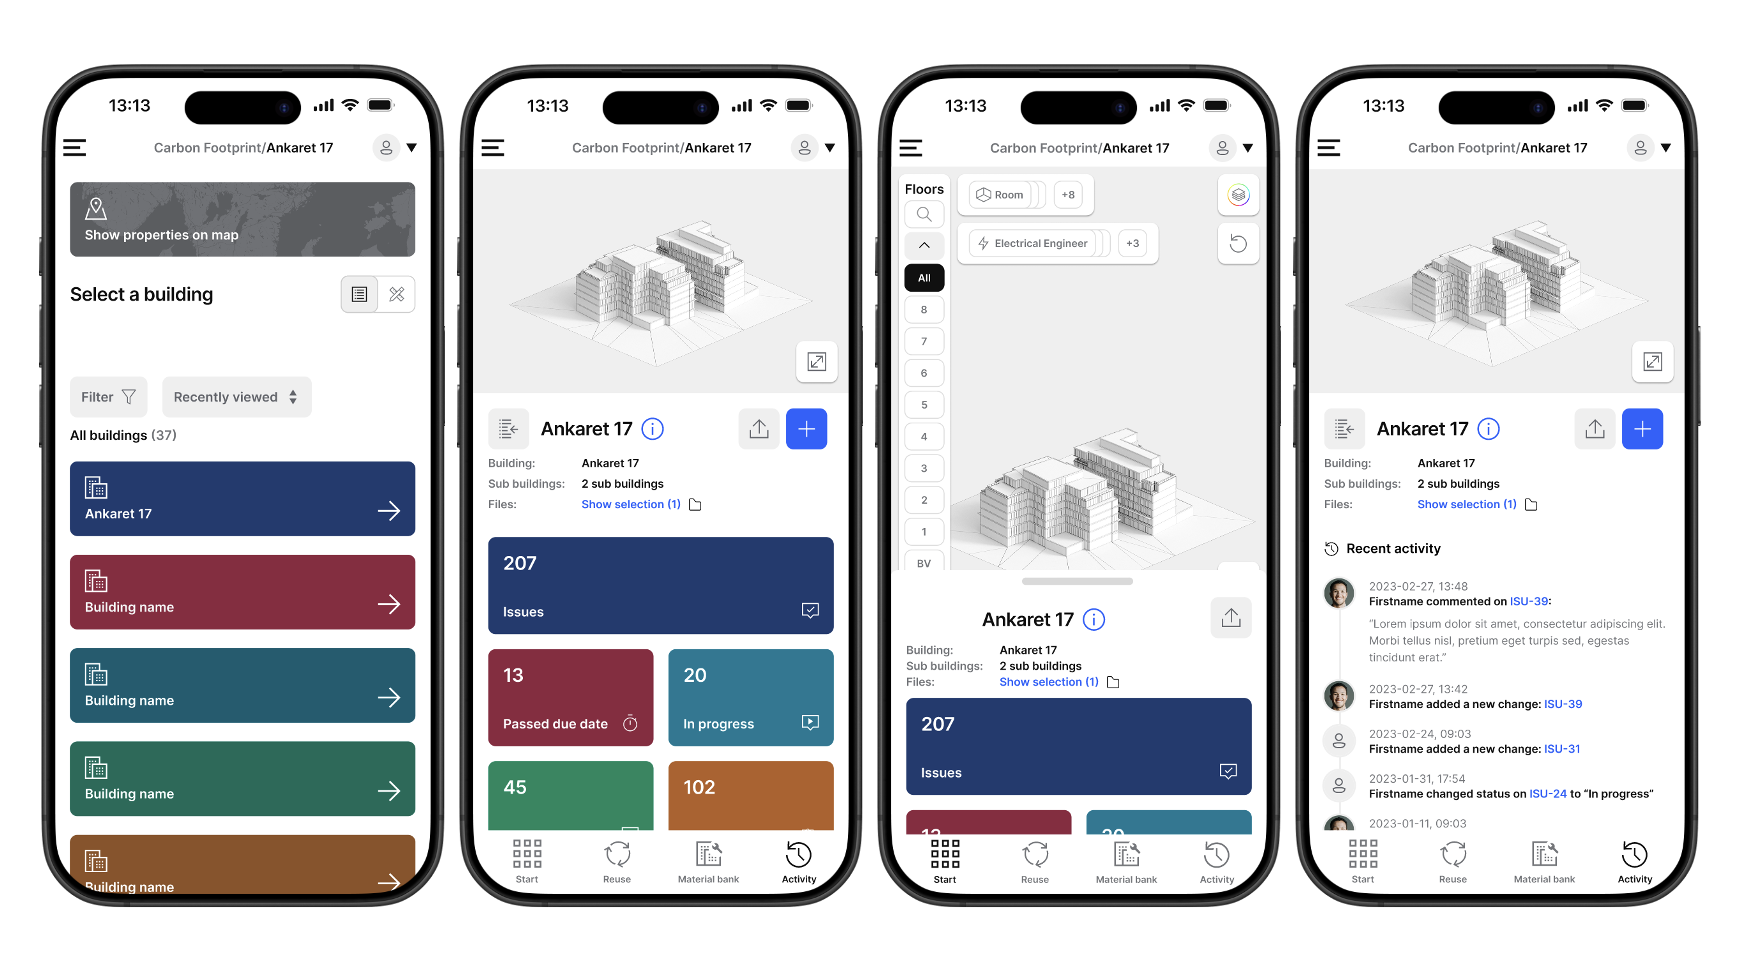
Combining our early paper sketches into a shared user flow, then developing low-, mid- and high-fidelity prototypes in Figma using Twinfinity’s design system.
04
Testing prototype flows with Twinfinity’s UX designers and other team members, then refining the interface based on feedback about navigation, usability and technical feasibility.
04 · Visuals
Early sketches and concepts from a Crazy 8s ideation workshop.
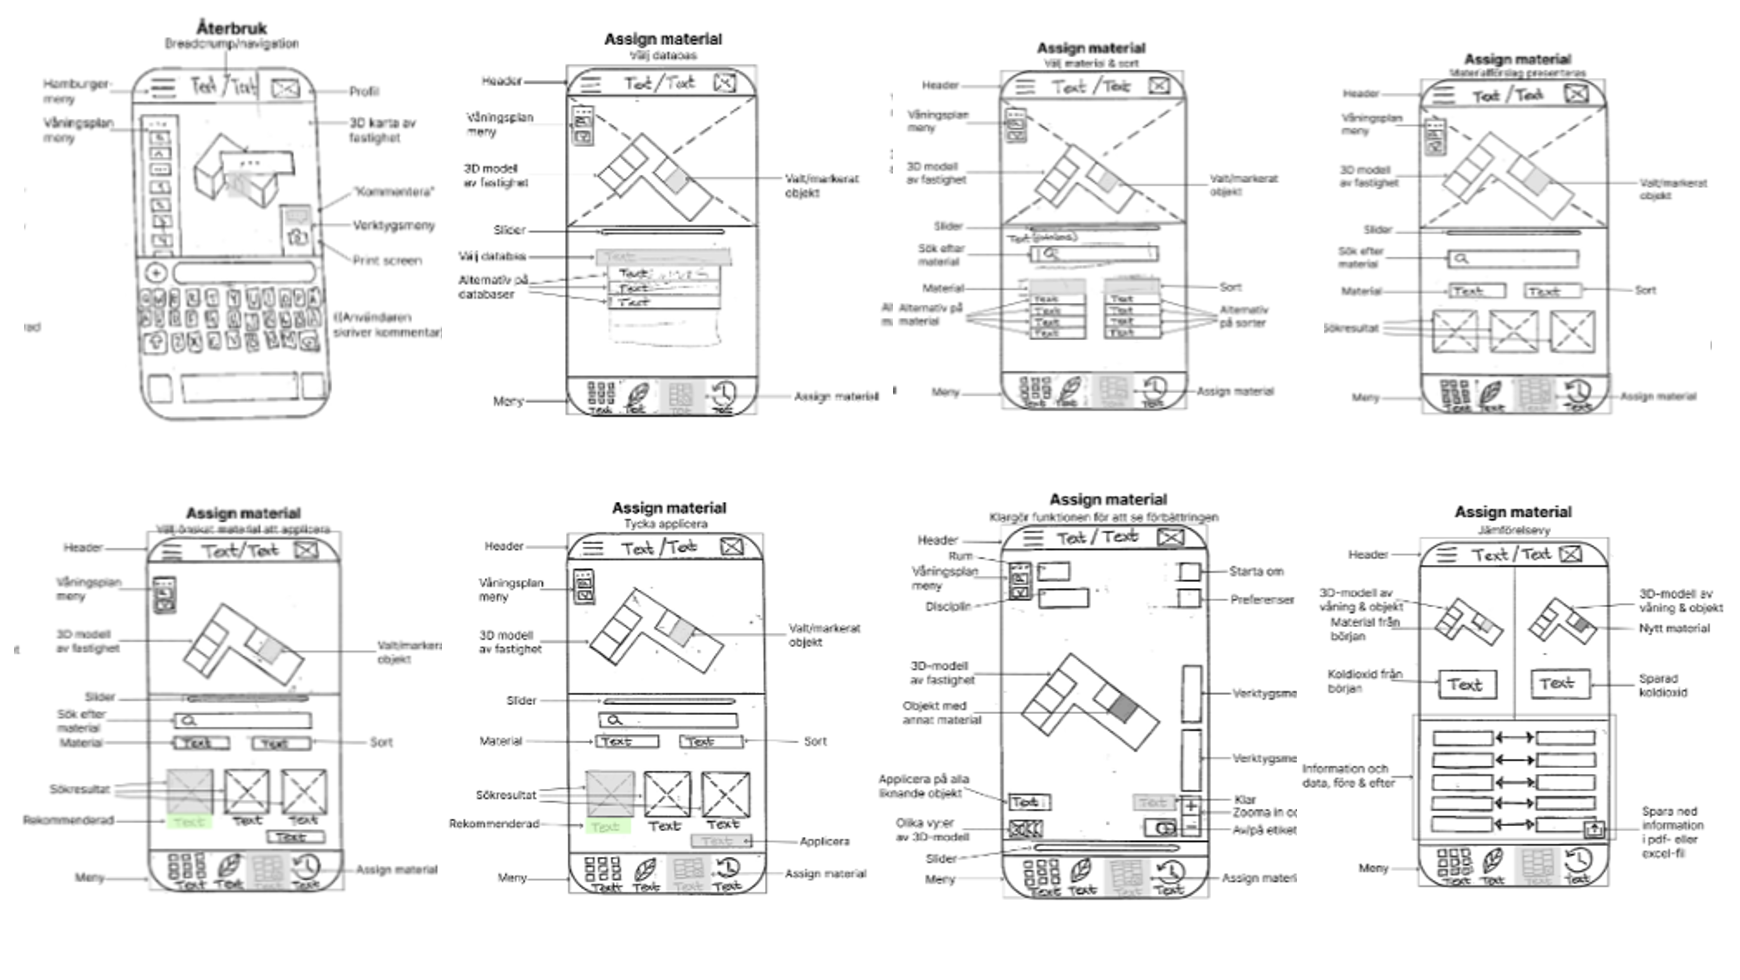
Hand-drawn low-fidelity prototypes used to explore structure, navigation and interaction.
An interactive high-fidelity prototype created in Figma using Twinfinity’s design system.
05 · Reflection
This project strengthened my understanding of how important domain knowledge is when designing for complex systems. Learning more about BIM, sustainability and the users’ workflows helped me identify what information mattered and make more informed design decisions.
It also reinforced that good data-driven design is not just about presenting information, but about structuring it in a way that helps users understand it and make better-informed decisions.